Compare Amazon Storefronts: Find the Overlap, the Gaps, and What Changed
Put two competitor storefronts, a brand catalog, or the same store a week apart on one Venn diagram. Click a segment and you get the exact ASIN list behind it.
Anyone who does serious Amazon seller research ends up performing the same ritual. Export one competitor's catalog. Export another's. Open a spreadsheet, line the ASIN columns up, and start writing VLOOKUPs, or COUNTIFs, or whatever incantation is supposed to answer a question that sounds embarrassingly simple:
Which products do these two sellers have in common?
And right behind it, the two follow-ups that make the first one worth asking:
- Which products do they both sell that I don't?
- What did this storefront drop, or add, since the last time I looked?
Amazon answers none of these. The spreadsheet answers them slowly, once, for exactly the two files you exported. By the time you've acted on it, both catalogs have moved.
We just shipped a Compare view in ASINSpotlight's Cloud Scanner that answers all three in one screen: pick two or three scanned lists (storefronts, brands, uploaded ASIN lists, even two snapshots of the same storefront taken a week apart) and their intersections appear as a clickable Venn diagram with a filtered product table underneath. This article covers how it works and the four research patterns it was built for.
Why the overlap between two storefronts is worth money
A single competitor's catalog tells you what one seller chose to sell. Every product in it is an experiment someone else ran. That's the whole logic of storefront stalking, and it's why reverse sourcing starts from a proven seller rather than a product database.
But one seller's choice is a weak signal. Sellers keep dead listings around, park failed experiments, and buy pallets they regret. The standard advice in online-arbitrage communities is to want several established sellers on a listing before you trust it. Which means the interesting set was never "everything seller X sells." It's the overlap: the products that two or three sellers you respect independently decided to carry, and keep carrying. Each additional storefront that contains the same ASIN is another operator who did their own math and reached the same answer.
Until now, finding that overlap meant the spreadsheet ritual. Cross-referencing storefronts is the one part of reverse sourcing that no storefront-stalking tool actually did. They extract catalogs one at a time, and the intersection stays your problem.
The overlap is only half of it. Every comparison produces three kinds of segments, and each one answers a different business question:
| Segment | What it contains | What it's for |
|---|---|---|
| The overlap | ASINs present in both (or all three) sources | The shortlist of independently validated products |
| The gaps | ASINs in one source but not another | What they sell that you don't; a brand's whitespace at a given seller |
| The change | ASINs in the Jul 1 snapshot but not the Jul 9 one, or vice versa | What a store dropped or added between any two dates |
How it works: up to three sources, one diagram
Any finished scan in Cloud Scanner can be compared: storefront, brand, uploaded ASIN list, keyword or category scan. The only rule is that all sources share a marketplace. Open any scan and hit Compare (that scan becomes source A), or start from the Compare scans button in the scan history. Pick a second source, optionally a third, and the diagram builds itself:
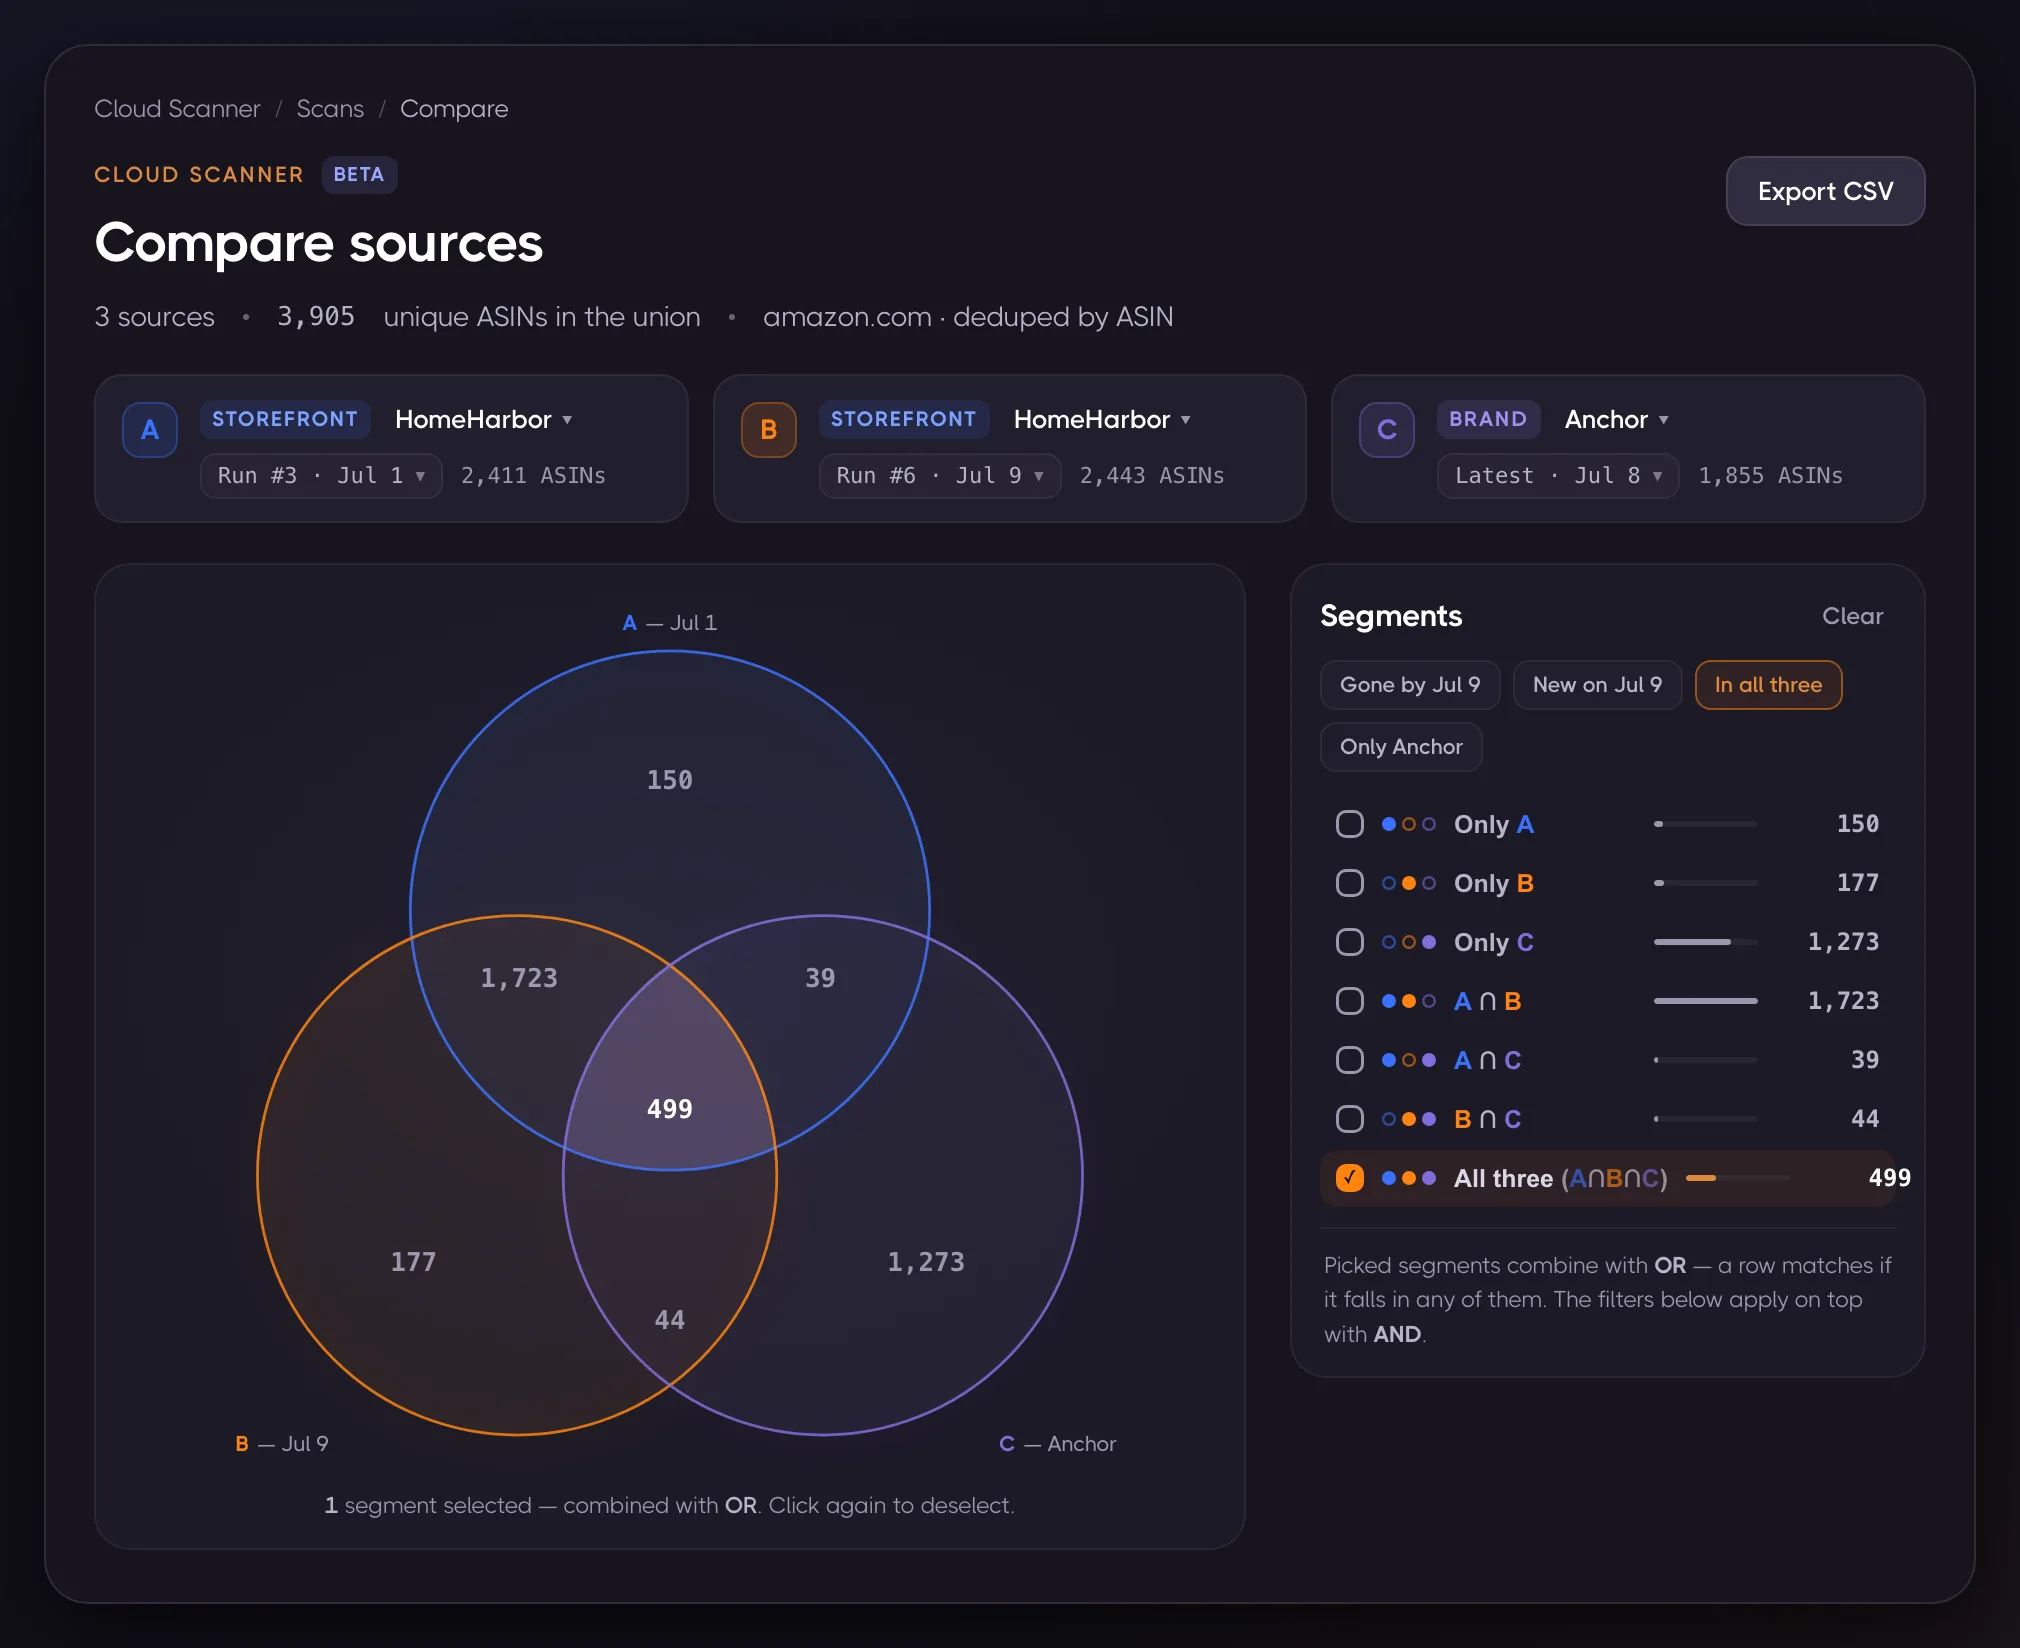
The circles are the sources, and every region is an exclusive segment. "In A and B but not C" is one region, "in all three" is another, and the counts always add up to the union. Click a region to filter the table below to exactly those ASINs. Click several and they combine with OR. The presets above the segment list name the combinations people actually reach for, like "Gone by Jul 9" or "In all three", so the common moves are one click.
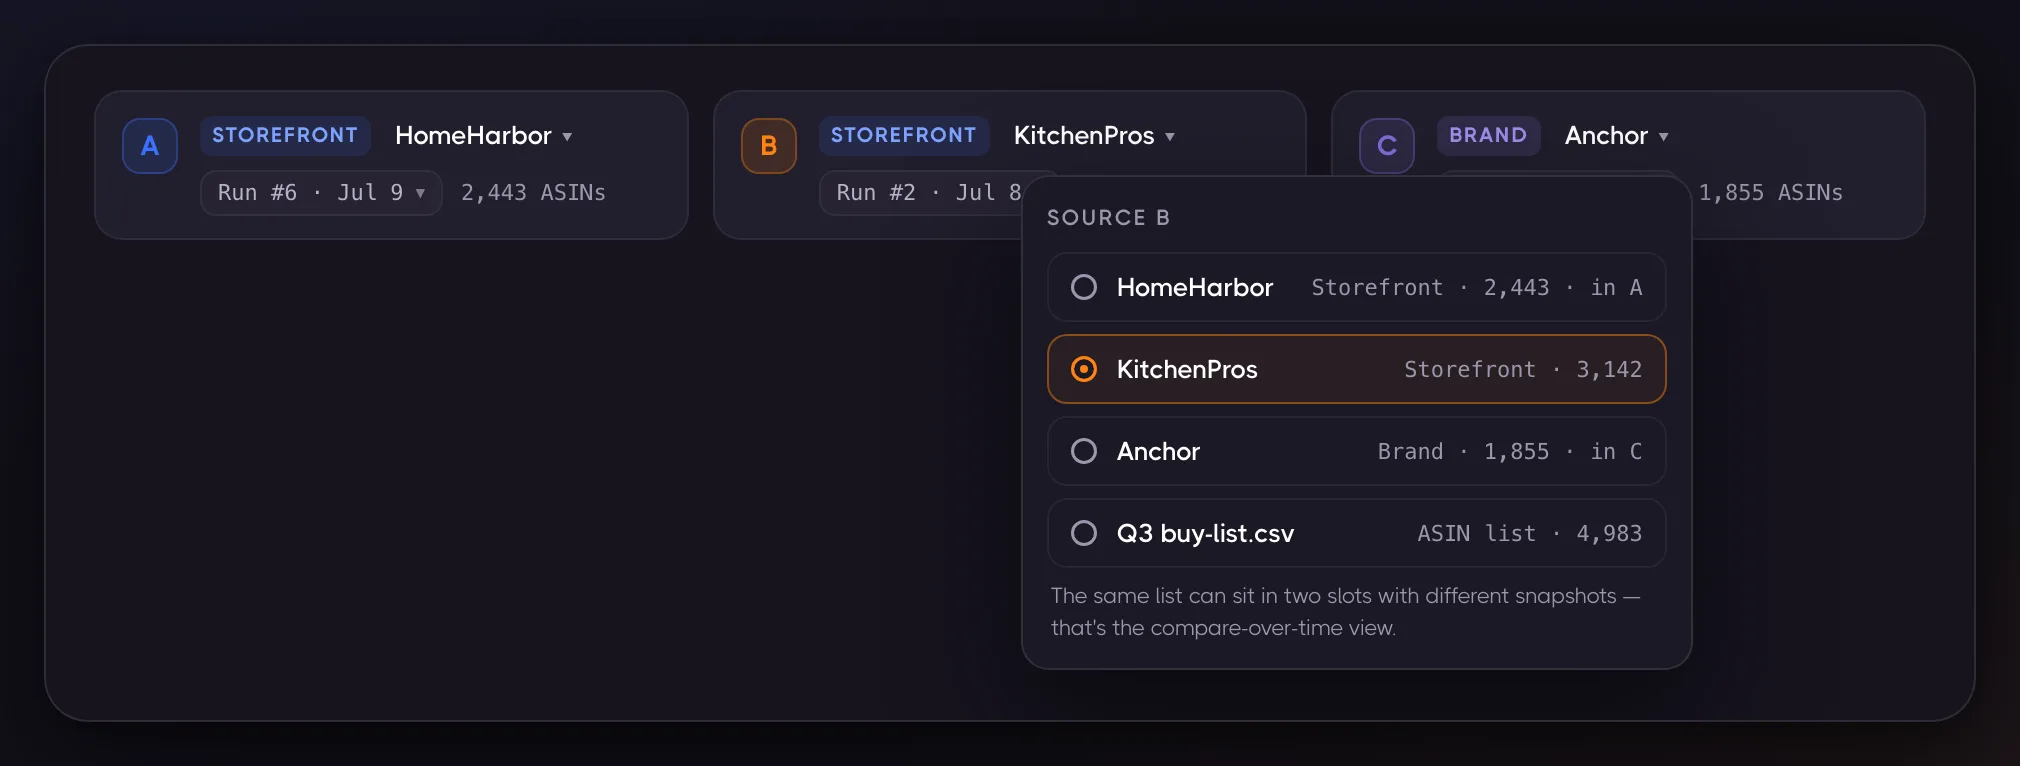
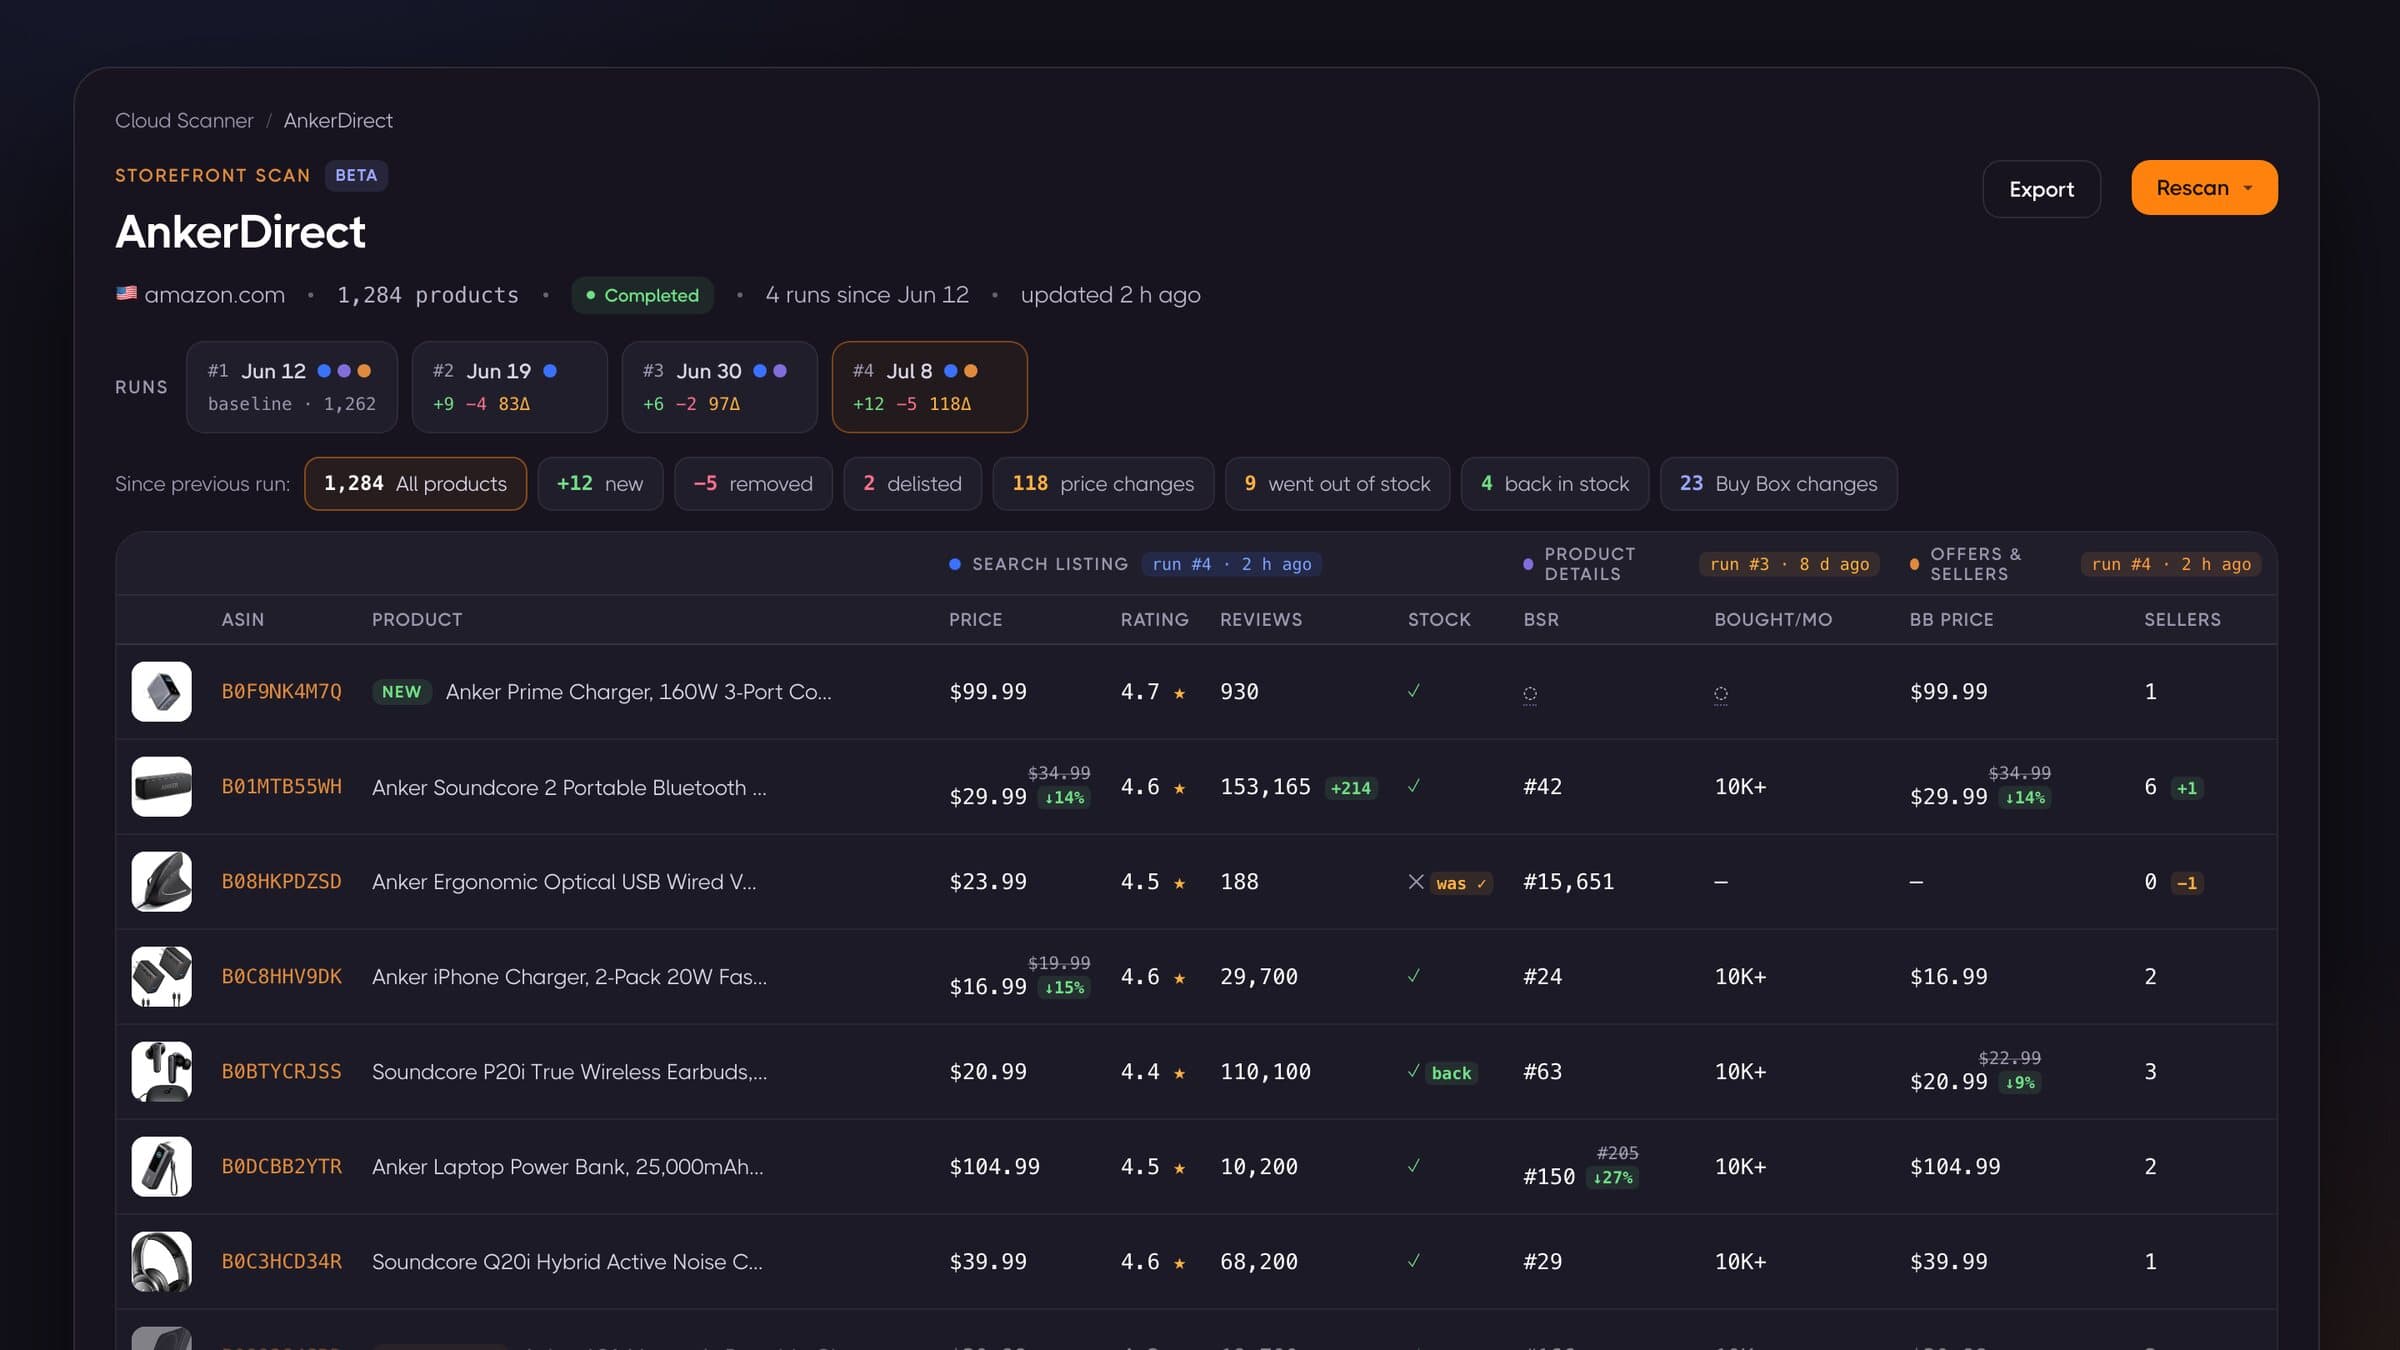
A source is more precise than "a list." It's a list at a point in time: any completed pass of any scan. That's why the screenshot above is legal. Source A and source B are the same storefront, pinned to different rescans, with a brand catalog as C. Swapping what a slot points to takes two clicks:
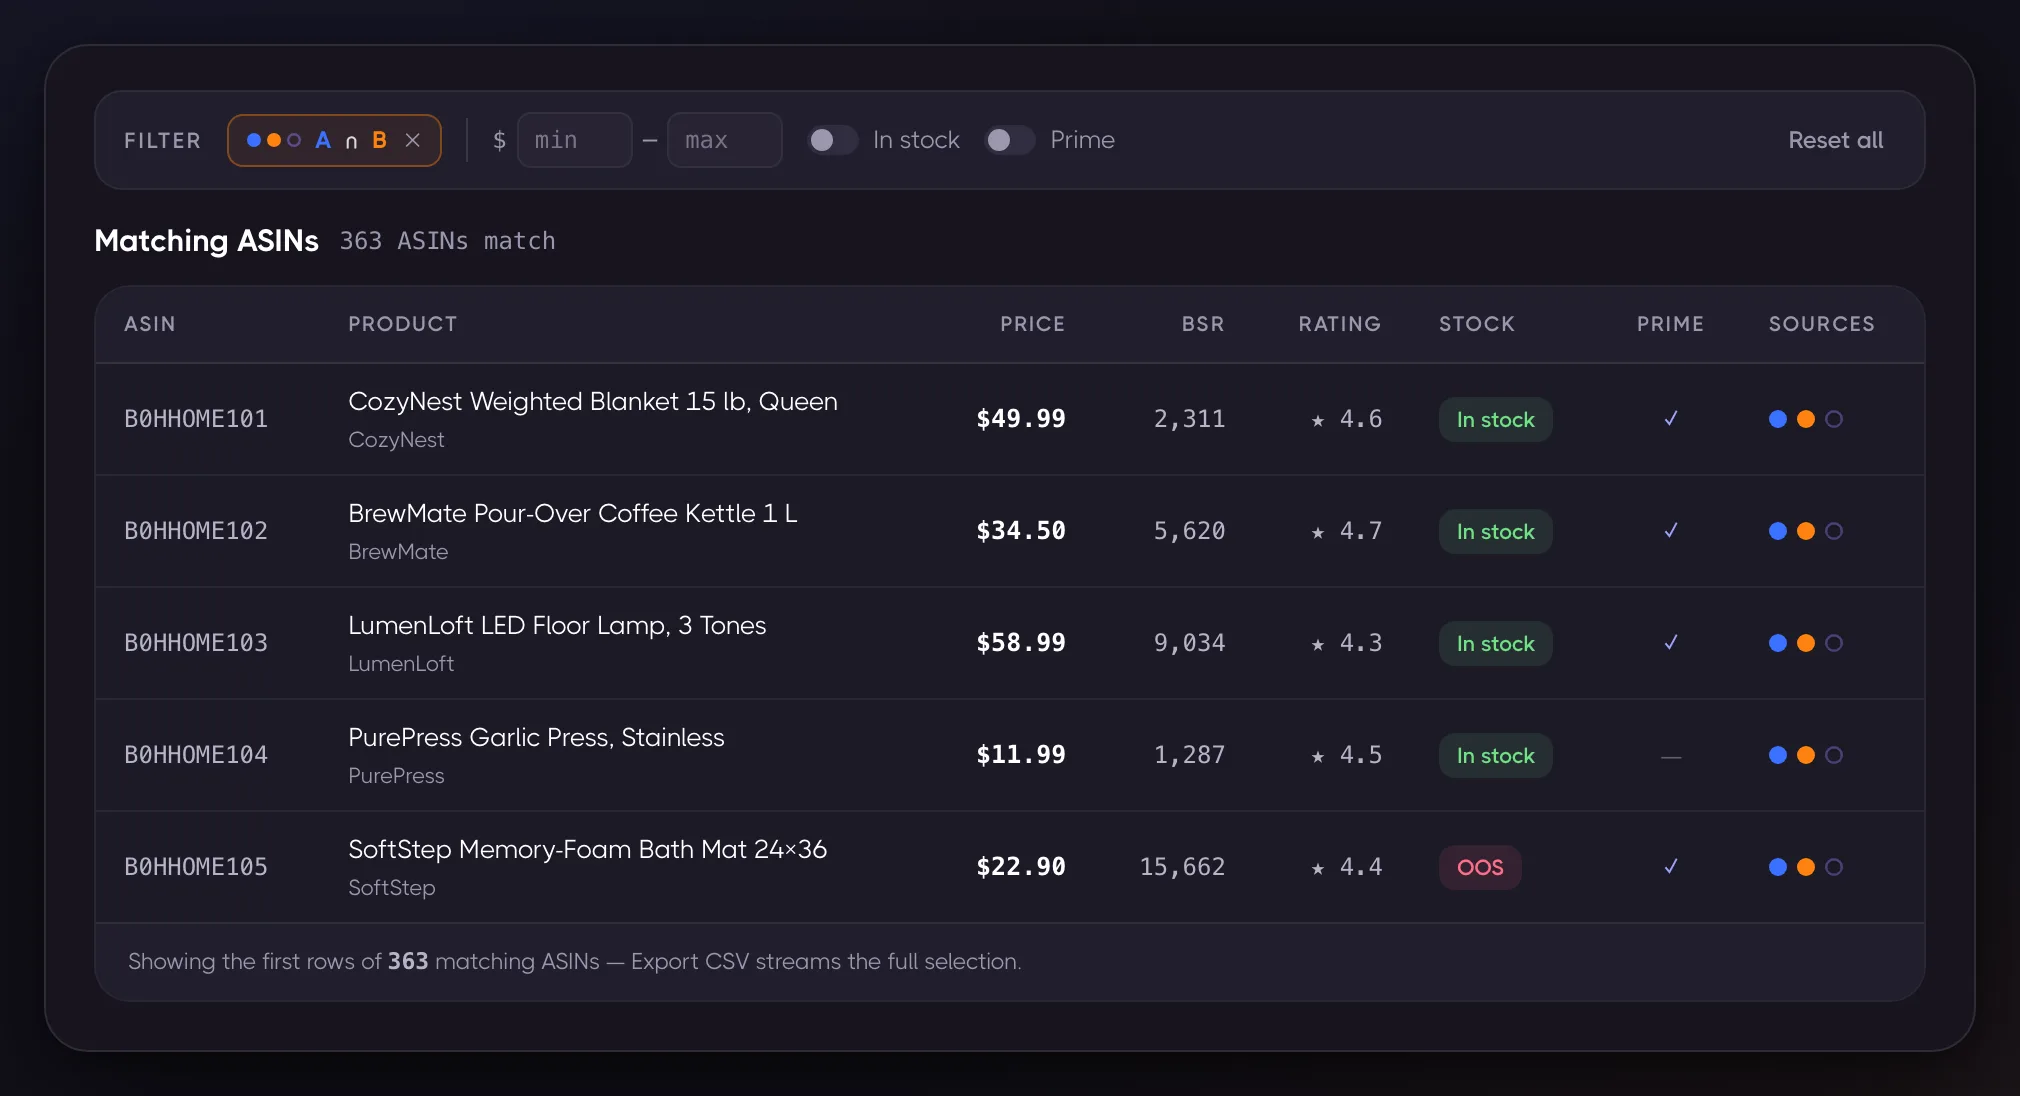
On top of the segment filter you get the standard table filters (price range, in-stock, Prime, title search), applied with AND. The table shows each product's latest known price, stock, rating, reviews and BSR, taken from the most recent compared source that contains it, plus a membership dot per source. And the whole view lives in the URL, so a comparison you've set up is a link you can bookmark or hand to a VA.
Three sources is a deliberate cap. Two circles have 3 regions and three have 7, all readable at a glance. Four sources would have 15, which is a spreadsheet drawn badly. If you need more than three, run the comparison in stages: export a segment, upload it as a list, compare it against the next pair.
Recipe 1: products two sellers both carry, that you don't
The purest sourcing move the Compare view enables:
- Scan two competitor storefronts (sellers whose model matches yours).
- Upload your own catalog as an ASIN list. A plain file of ASINs is enough.
- Compare all three and click the segment that reads A ∩ B: in both storefronts, not in your list.
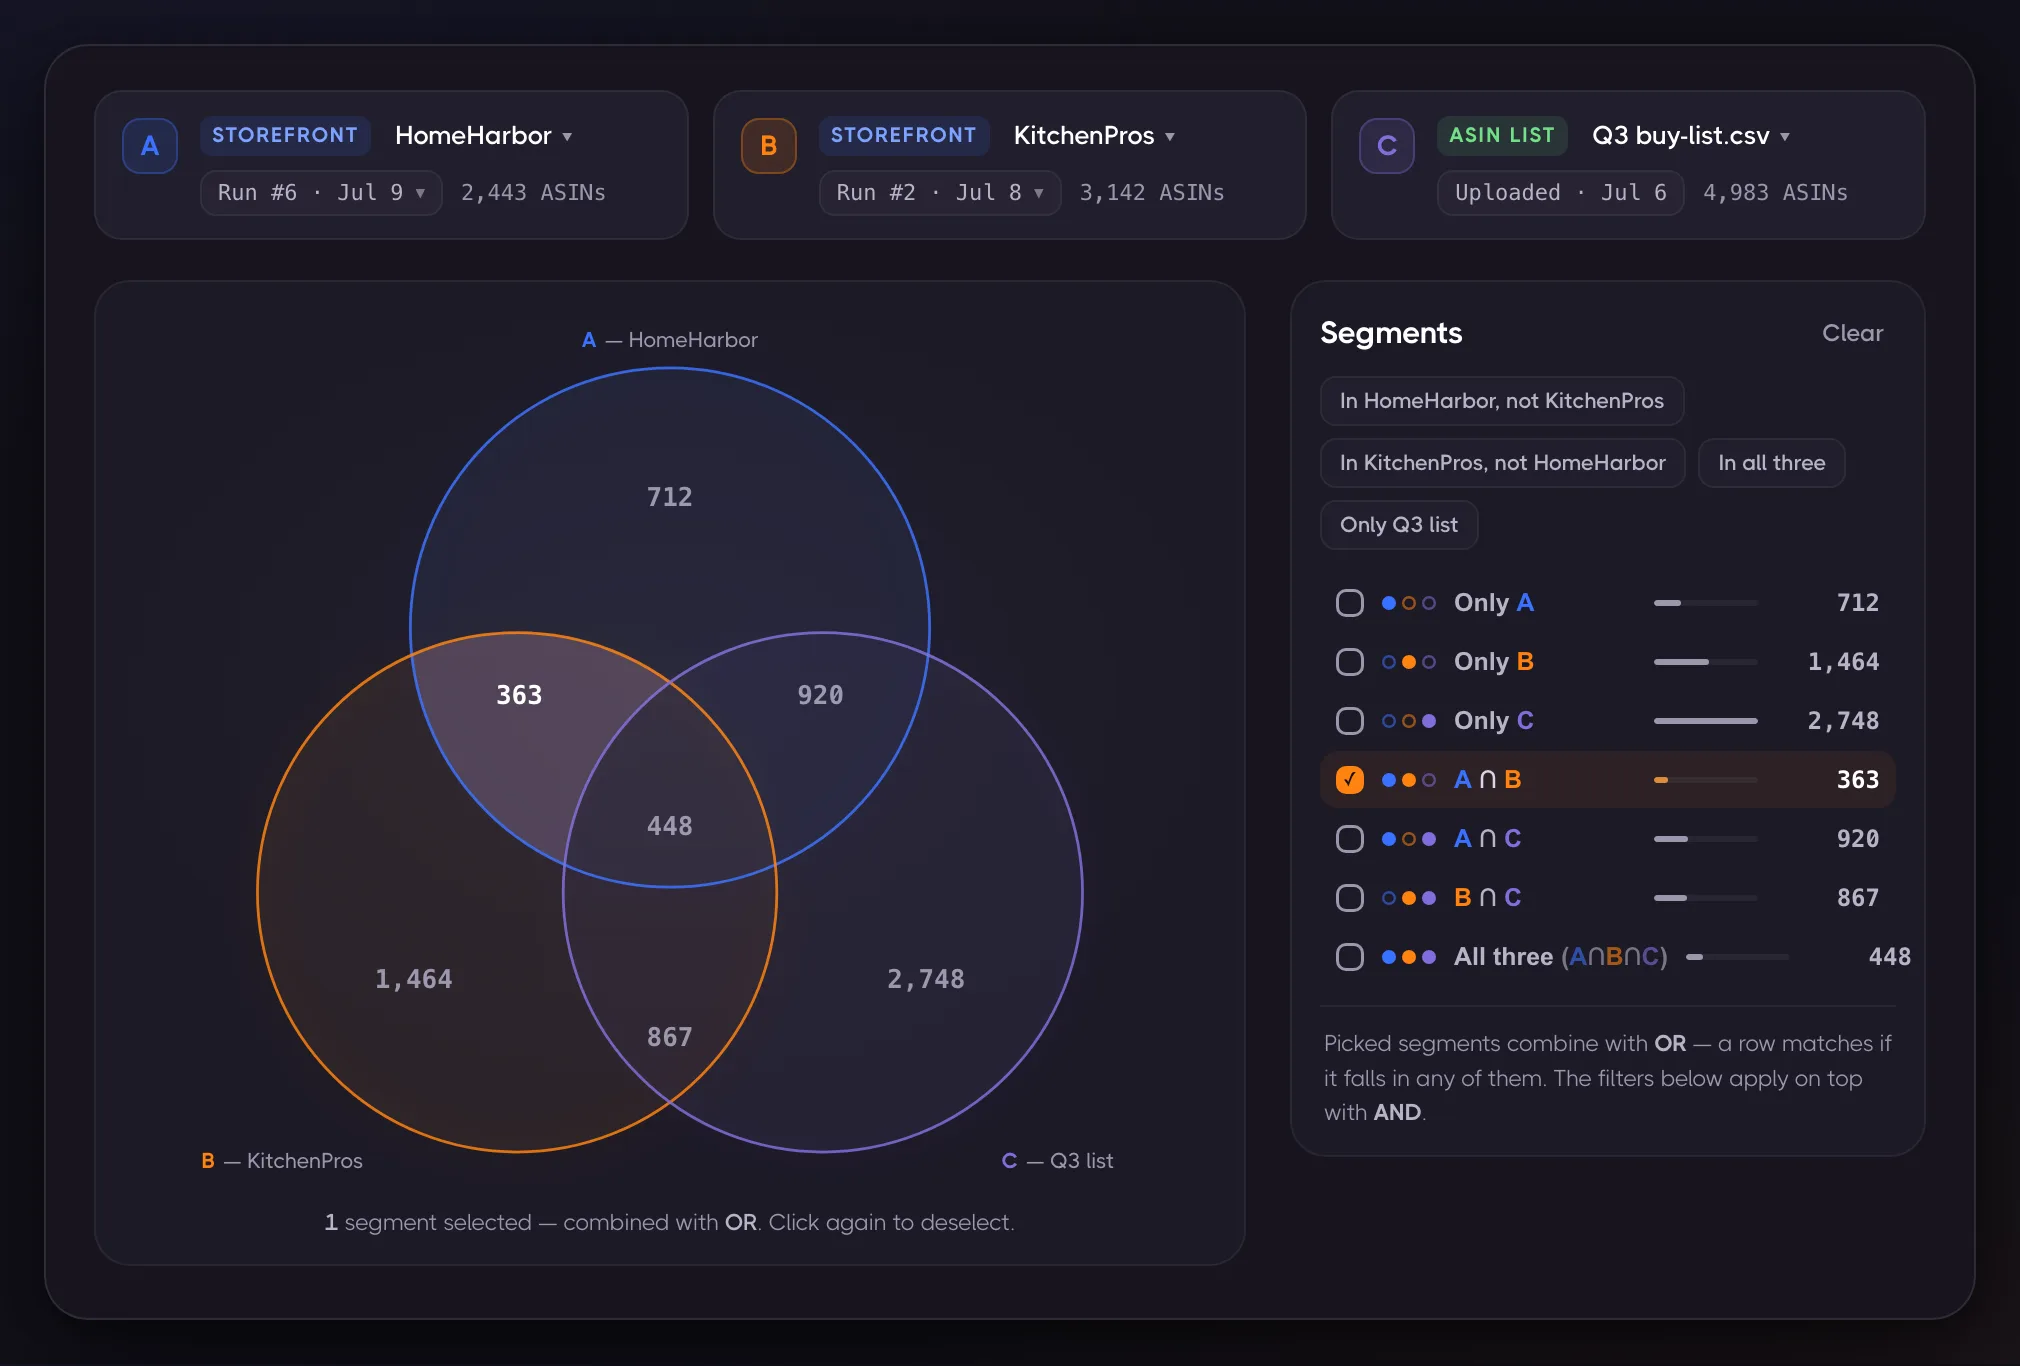
That segment is a pre-validated sourcing shortlist: every ASIN in it was independently chosen by two operating sellers, and none of it overlaps what you already carry. Filter it to in-stock and your price band, sort by review count or BSR, and you're looking at what used to take hours of manual cross-referencing, computed in one query.
The same shape works as pure catalog gap analysis against a single competitor: your list vs. their storefront, click "in theirs, not in mine." It also works defensively. "In mine, not in theirs" shows which part of your assortment a rival hasn't matched yet.
One honest caveat: the comparison matches by ASIN, exactly. Two sellers offering the same physical product under different ASINs (different variation children, a bundle, a duplicate listing) won't intersect. The overlap you see is real, but it's a floor, not a ceiling.
Recipe 2: brand vs. storefront, or who carries what
Brand scans compare against storefronts just as freely, which opens the assortment-gap questions from the other side:
- For resellers and wholesale buyers: compare the Anchor brand catalog against a storefront that clearly specializes in it. The overlap is the part of the brand's line they've committed to. The brand-only segment is whitespace: products in the line that this seller doesn't carry (run it again for the next seller). That's either an opportunity nobody's taken or a graveyard everyone has quietly avoided; the table's BSR and review columns usually tell you which.
- For brand owners: the same comparison run in reverse tells you how much of your line a given reseller actually stocks, and what of theirs sits next to your products. Repeat against your top three resellers and you have a distribution-coverage picture that would otherwise take an afternoon of tab-switching.
Recipe 3: the same storefront, two dates apart
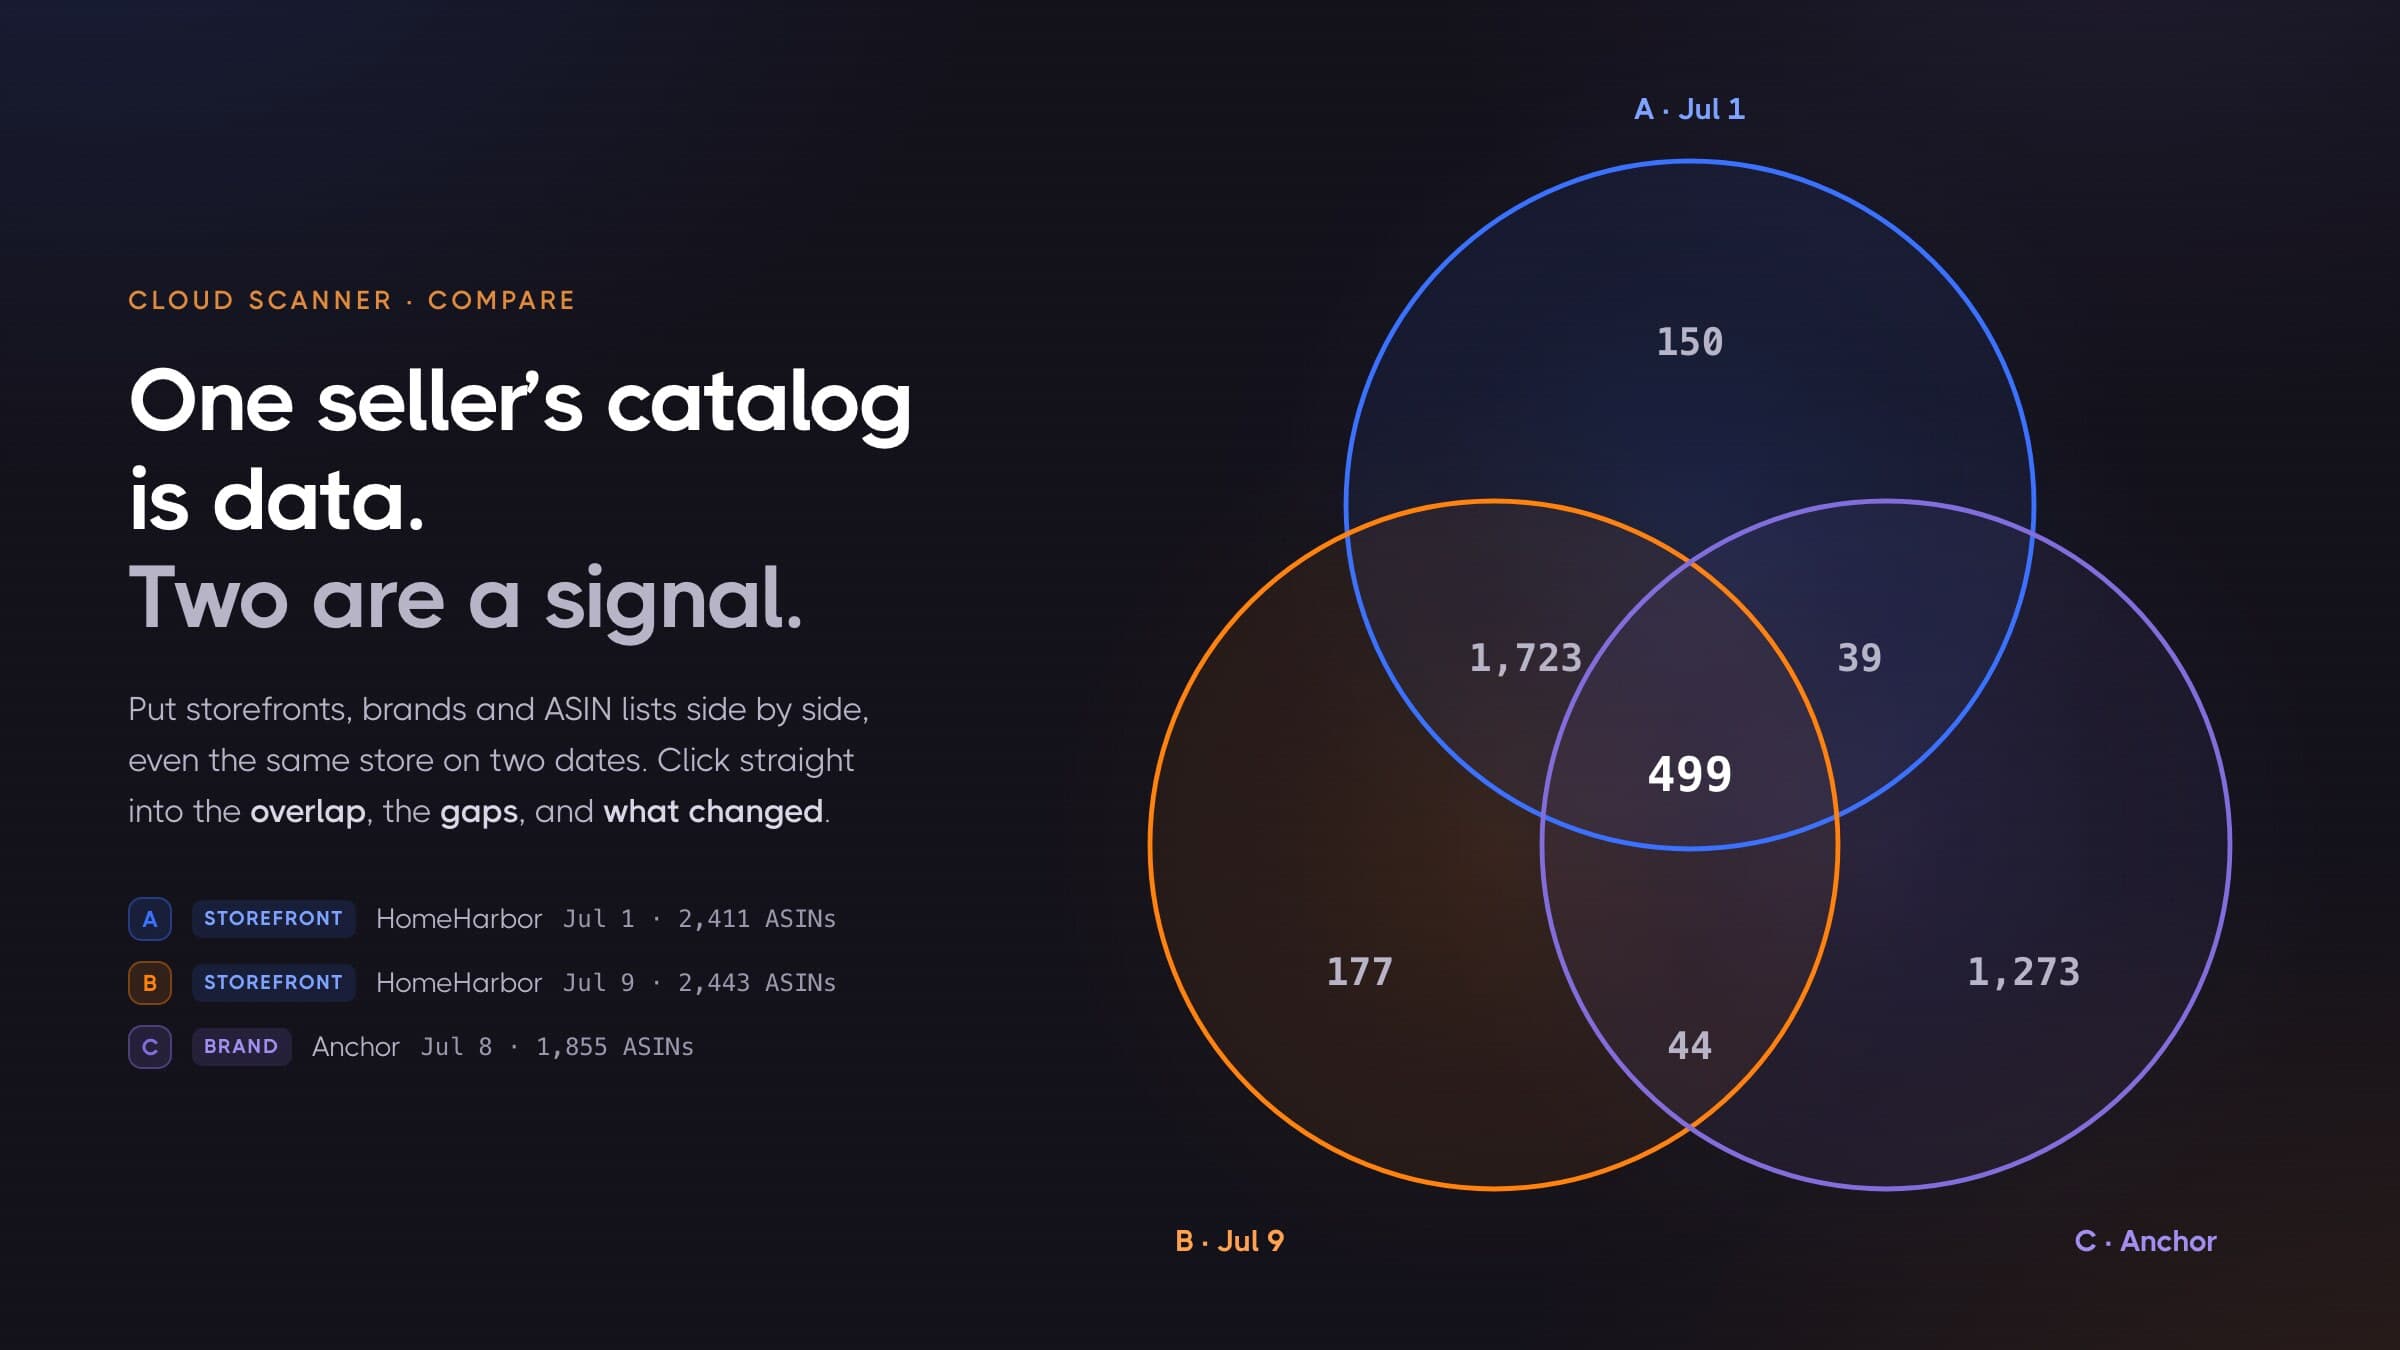
Every scan in Cloud Scanner can be re-run, and any two completed runs can be compared, not just the latest against the previous one. Put the July 1 snapshot in slot A and the July 9 snapshot in slot B:
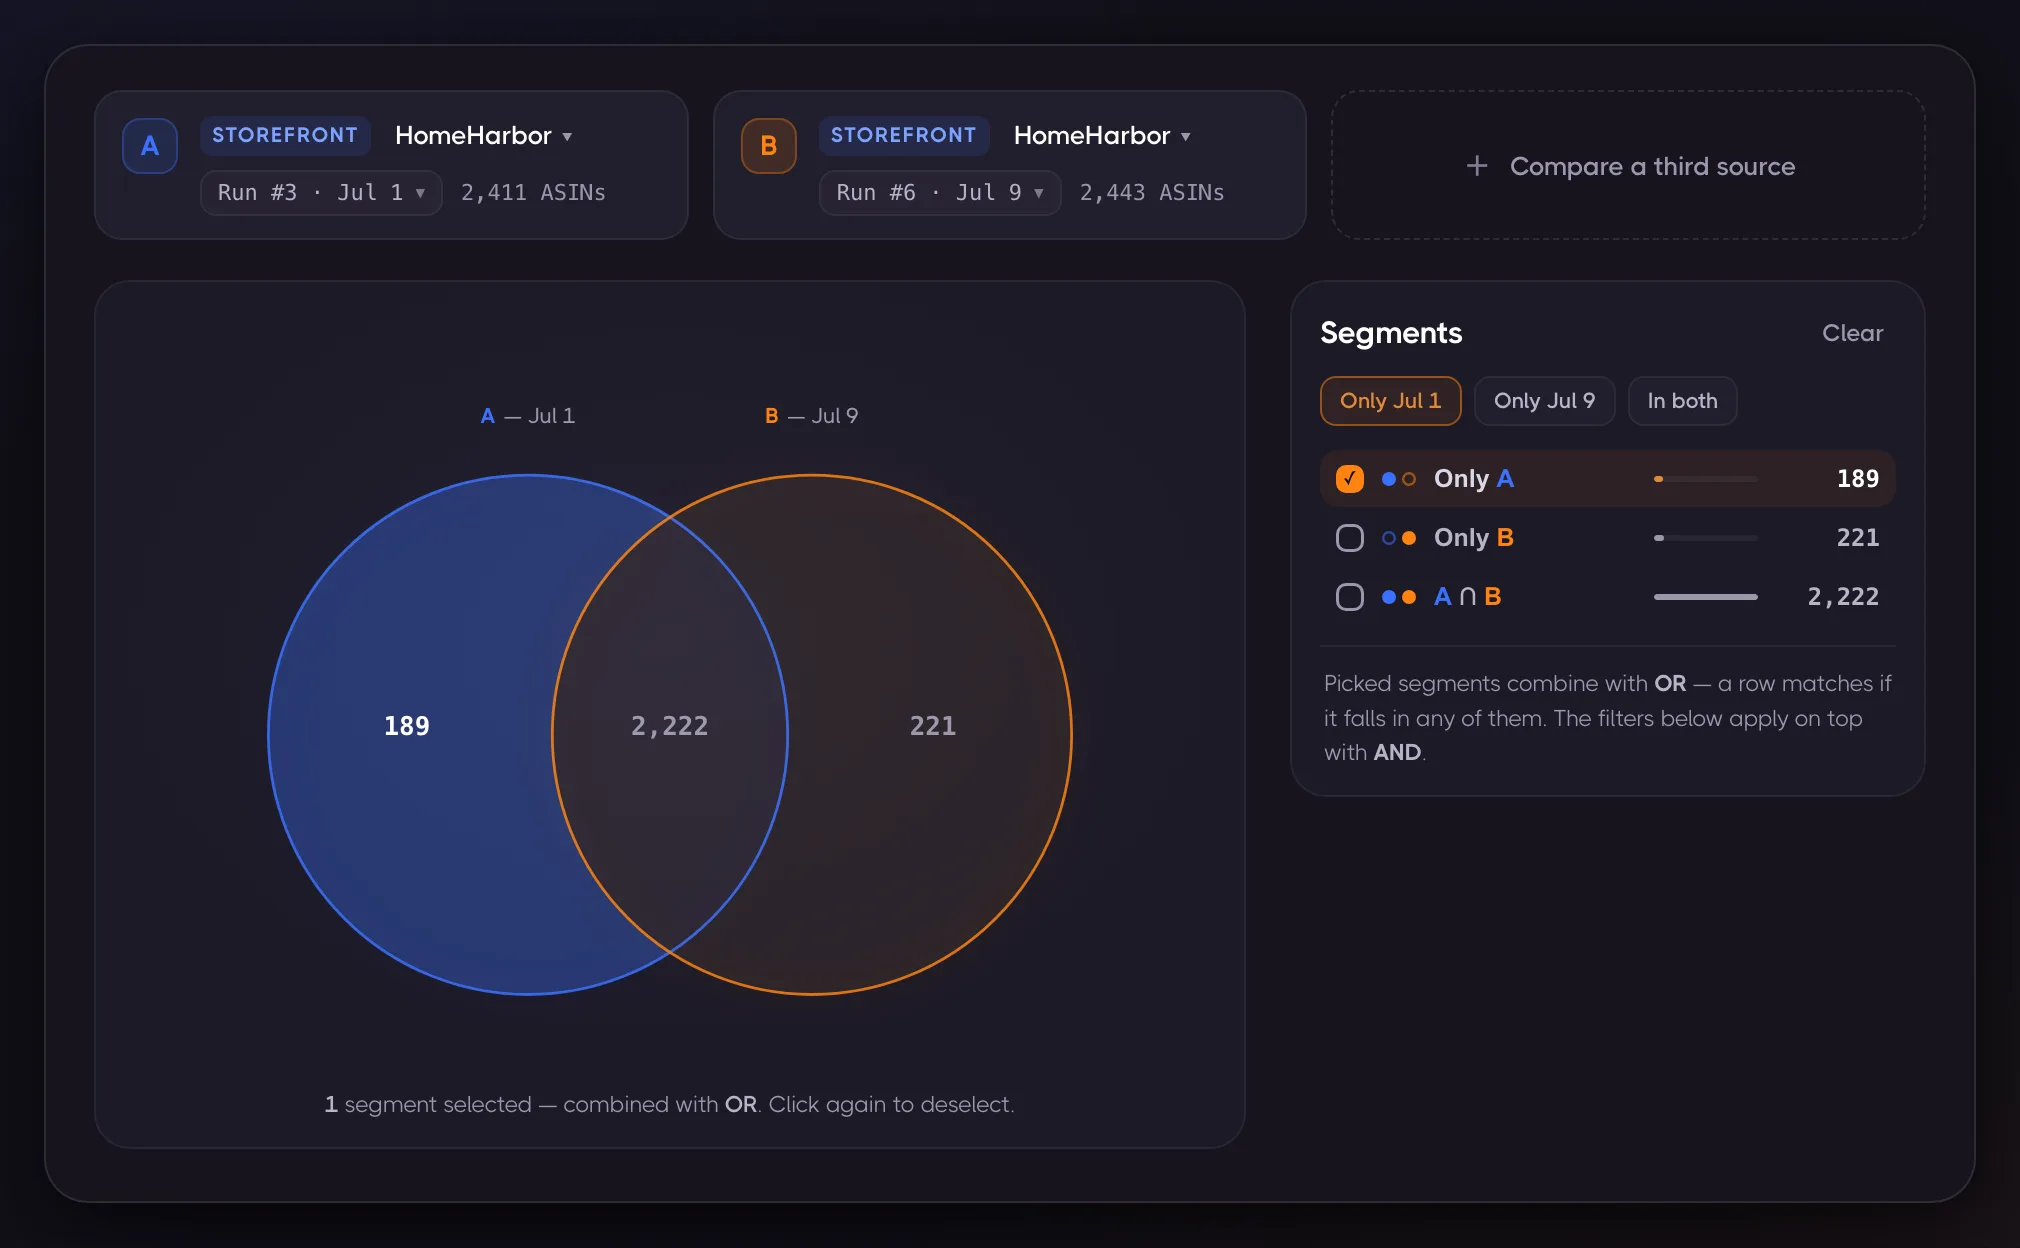
"Only Jul 1" is everything that left the storefront in those eight days. "Only Jul 9" is everything new. The 2,222 in the middle is the stable core. Add a brand as the third circle and the time question sharpens into "which Anchor products did they drop this week?", which is a restocking or wholesale signal you can act on directly.
Rescans already produce a change digest covering new, removed, price moves, stock-outs and Buy Box flips, and for week-to-week monitoring that digest is the faster read. The Compare view answers the set questions the digest doesn't: arbitrary pairs of dates rather than consecutive runs, and membership change crossed with another list.
From a segment to a spreadsheet
Every combination of segments and filters is exportable. The CSV carries the product columns, one membership column per source (In A, In B, In C, each headed with the source's actual name), and a Segment letters column, so the Venn structure survives into Excel, a pivot table, or whatever your sourcing pipeline eats. Exports stream, so a 100,000-row segment downloads the same way a 500-row one does.
What it costs: nothing on top of the scans
Comparing is free. There's no per-comparison fee and no credit charge for opening the Compare view, clicking segments, or exporting. You pay only for the underlying scans, once, at the normal Cloud Scanner rates:
| Getting a source | Credit cost |
|---|---|
| Storefront, brand, or ASIN-list scan | 1 credit per 10 products |
| Keyword or category scan | 1 credit per 20 products |
Credit packs start at $12 for 10,000 credits, with no subscription. So the full Recipe 1 setup (two 3,000-product competitor storefronts plus your own 5,000-ASIN list) costs about 1,100 credits, roughly $1.30. Every comparison you run across those three sources afterwards costs nothing.
The honest caveat is freshness: a comparison is between snapshots, and it's exactly as current as the scans behind it. If a sourcing decision hangs on the result, re-run the storefronts first. A listing-layer rescan costs the same 1 credit per 10 products, so refreshing both example storefronts above is about 70 cents.
Frequently asked questions
How do I find the products two Amazon sellers have in common? Scan both storefronts in Cloud Scanner, open one of them, and hit Compare with the other as source B. The middle region of the diagram is the shared catalog. Click it and the table shows every common ASIN with price, stock, rating and BSR, ready to filter or export.
Can I compare my own catalog against a competitor's storefront? Yes. Upload your catalog as an ASIN list (file uploads are supported up to 10 million rows) and compare it against any scanned storefront. "In theirs, not in mine" is the gap; "in mine, not in theirs" is your defensible ground.
Can I compare two ASIN lists without Excel? Yes. Upload both as list scans and compare them. You get the intersection, both differences, live Amazon data for every row, and a CSV export with membership columns. No VLOOKUP.
Can I compare storefronts from different marketplaces? No. All sources in one comparison must be from the same Amazon marketplace, because the same product carries different data (and often different ASINs) across marketplaces. Scan and compare per marketplace instead.
Can I compare more than three lists? Not in one diagram: three sources produce 7 readable regions; four would produce 15. For wider sweeps, work in stages. Export the segment you care about, upload it as a new list, and compare that against the next sources.
Does comparing two rescans of the same scan work? Yes. Any completed run of a scan can be a source, including two runs of the same scan. That's the compare-over-time view, and you pick the snapshot per slot.
What if two sellers sell the same product under different ASINs? It won't show up in the overlap. Matching is by exact ASIN, so bundles, duplicate listings and different variation children count as different products. Treat the overlap as a floor on how much two catalogs really share.
Does the comparison itself cost credits? No. Scans cost credits; comparing, filtering and exporting the comparison don't.
Cross-referencing seller catalogs has always been the most information-dense move in Amazon research, and the most annoying one to actually perform. Now it's a diagram you click.
The Compare view is live for every Cloud Scanner user, in beta. See how Cloud Scanner works, or run your first scans. Credit packs start at $12, and comparing them is free.
Latest articles
Amazon Deals API: How to Track Lightning Deals, Coupons, and Discounts Programmatically
Amazon Storefront Stalking: See Every Product, Not a Sample